Investor Overview
AMG offers shareholders a unique opportunity to invest, at scale, in a diverse array of growing and cash-flow-generating independent investment firms through a proven partnership approach. Our Affiliates offer differentiated strategies across private markets, liquid alternatives, high-value equity, and multi-asset strategies.
Our strategy centers on making equity investments in growing, partner-owned firms, and collaborating with and investing alongside these firms to enhance their ongoing evolution. Having partnered with independent firms for 30 years, we have applied our unique and unmatched experience in developing powerful strategic capabilities – including business development support, growth capital, product development, distribution, and succession planning – to magnify our Affiliates’ long-term success while preserving their distinct entrepreneurial cultures and independence. Through an investment in AMG, shareholders access the growth of this diverse set of high-quality independent managers offering distinctive return streams in areas of secular demand, with strong long-term investment track records.
Our business generates significant discretionary capital; we deploy that capital through growth investments in new and existing Affiliates, and consistently return excess capital to shareholders as appropriate, including through share repurchases and our quarterly cash dividend. Making disciplined capital allocation decisions to create shareholder value is fundamental to our culture and our strategy.
Stock Information
Exchange
Price
Change (%)
Volume
Data as of 01/21/25 10:43 PM EST
Minimum 15 minutes delayed. Source: LSEG
Key Financial Metrics
| 2020 | 2023 | 2020 - 2023 CAGR | |
|---|---|---|---|
| AUM (at period end, in billions) | $716.2 | $672.7 | (2%) |
| Average AUM (in billions) | $664.4 | $660.3 | (0%) |
| Aggregate Fees | $4,626.4 | $5,066.6 | 3% |
| Financial Performance Measures | |||
| Net income (controlling interest) | $202.2 | $672.9 | |
| Earnings per share (diluted) | $4.33 | $17.42 | |
| Supplemental Performance Measures* | |||
| Adjusted EBITDA (controlling interest) | $795.3 | $935.7 | 6% |
| Economic net income (controlling interest) | $621.7 | $717.8 | 5% |
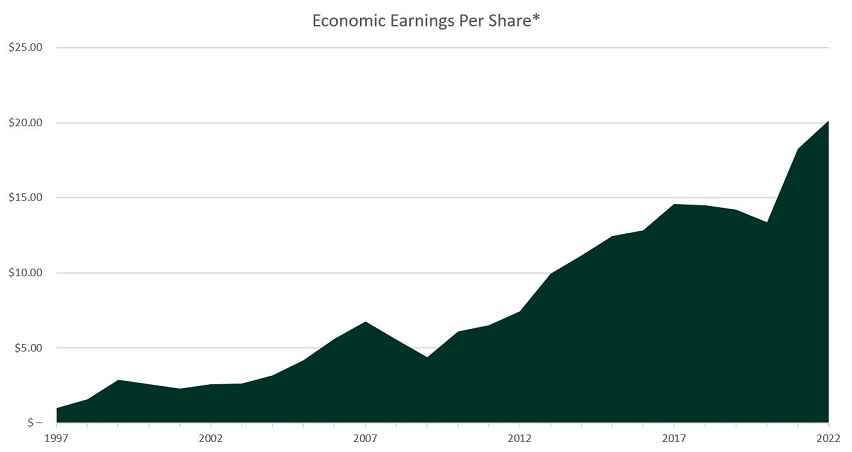
| Economic earnings per share | $13.30 | $19.48 | 14% |
| Debt | $2,312.1 | $2,537.5 | |
| Credit rating (Moody's / S&P) | A3 / BBB+ | A3 / BBB+ | |
Note: Data in millions, except where noted or per share data.
*As supplemental information, we provide non-GAAP performance measures of Adjusted EBITDA (controlling interest), Economic net income (controlling interest), and Economic earnings per share. We believe that many investors use our Adjusted EBITDA (controlling interest) when comparing our financial performance to other companies in the investment management industry. Management utilizes these non-GAAP performance measures to assess our performance before our share of certain non-cash GAAP expenses primarily related to the acquisition of interests in Affiliates and to improve comparability between periods. Economic net income (controlling interest) and Economic earnings per share are used by management and our Board of Directors as our principal performance benchmarks, including as one of the measures for determining executive compensation. These non-GAAP performance measures are provided in addition to, but not as a substitute for, Net income (controlling interest), Earnings per share, or other GAAP performance measures. For additional information on our non-GAAP measures and reconciliations to GAAP, see our most recent Annual Report on Form 10-K (or, with respect to amounts above for 2020, our Quarterly Report on Form 10-Q for the quarter ended March 31, 2023), which are accessible on the SEC’s website at www.sec.gov.